Living to 90 isn’t impressive if you spent the last 20 years disabled, cognitively impaired, and dependent on others. Healthspan, the years you live with vitality, function, and independence, matters more than lifespan alone. The distinction isn’t philosophical; it’s the difference between a long decline and decades of meaningful living. Increasingly, longevity medicine focuses not just on extending life but on compressing morbidity, the period of decline before death, into the shortest possible window.
Certain biomarkers predict healthspan remarkably well. These metrics capture how effectively your body processes energy, handles stress, maintains muscle, and protects against chronic disease. Track and optimize them, and you’re not just potentially living longer; you’re investing in the quality of those additional years. The research from gerontology and preventive medicine has identified which markers matter most and what targets to aim for.
These aren’t exotic tests requiring specialized clinics. Most are measurable through standard blood work, simple physical assessments, and widely available monitoring. The challenge isn’t access but awareness: knowing what to track, understanding what the numbers mean, and recognizing when intervention is needed. Dr. Peter Attia, whose longevity-focused medical practice has popularized many of these concepts, argues that optimizing these biomarkers represents “medicine 3.0,” a proactive approach that prevents disease rather than merely treating it after emergence.
Metabolic Biomarkers: The Foundation of Healthspan
Metabolic health, how effectively your body processes energy, manages blood sugar, and regulates fat metabolism, fundamentally determines healthspan. Dysfunction in these systems drives the chronic diseases that rob people of healthy years: type 2 diabetes, cardiovascular disease, dementia, and cancer. The good news is metabolic health is highly modifiable through lifestyle interventions, and tracking key biomarkers allows you to catch and correct problems years before disease develops.
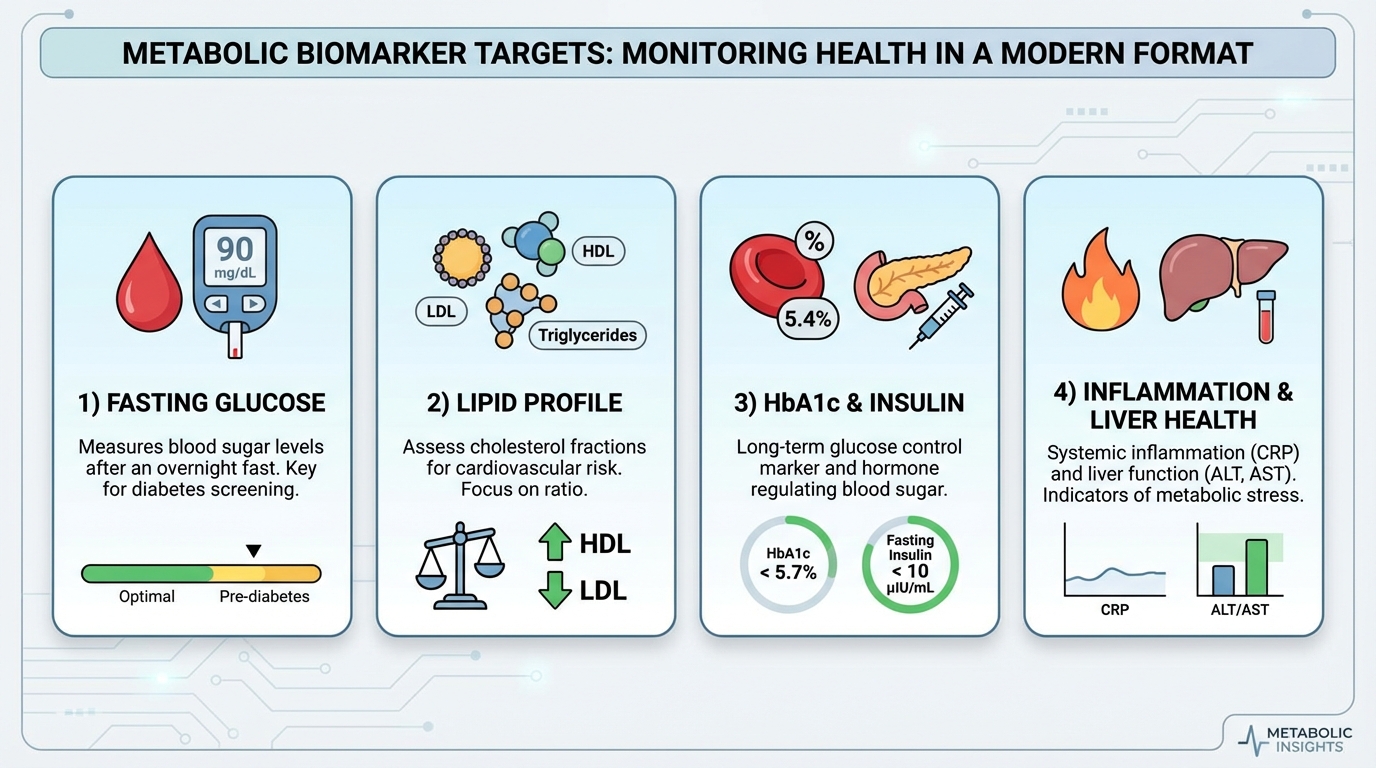
Fasting glucose measures blood sugar after an overnight fast of 8-12 hours without food. The optimal range is 70-85 mg/dL, significantly tighter than the clinical “normal” range that extends to 99 mg/dL. Levels between 100-125 mg/dL indicate pre-diabetes, and 126+ mg/dL confirms diabetes. But even “elevated-normal” glucose in the 85-99 mg/dL range associates with increased risk of diabetes, cardiovascular disease, and cognitive decline compared to truly optimal levels. Research published in Diabetes Care demonstrates that even modest elevations in fasting glucose predict future metabolic disease. This marker responds powerfully to dietary changes (reducing refined carbohydrates, increasing fiber), regular exercise, weight loss if overweight, and adequate sleep.
HbA1c, or glycated hemoglobin, reflects average blood glucose control over the previous 3 months, providing a longer-term view than single fasting glucose measurements. Red blood cells circulate for approximately 90 days, and hemoglobin bound to glucose (glycation) reflects cumulative blood sugar exposure during that period. Optimal HbA1c is under 5.3%, though the clinical cutoff for pre-diabetes doesn’t begin until 5.7%. The pre-diabetes range extends from 5.7-6.4%, with diabetes defined as 6.5% or higher. Because it averages glucose over months, HbA1c better predicts long-term complications than fasting glucose alone and provides insight into glucose variability that single measurements miss.
Fasting insulin often gets overlooked despite being an earlier warning sign than glucose. When insulin resistance develops, your pancreas compensates by producing more insulin to maintain normal blood sugar. Glucose levels may remain normal for years while insulin silently climbs, representing the earliest phase of metabolic dysfunction when interventions are most effective. Optimal fasting insulin is under 5 µIU/mL, with levels over 10 µIU/mL concerning. Dr. Benjamin Bikman at Brigham Young University, author of Why We Get Sick, has extensively documented how hyperinsulinemia (chronically elevated insulin) drives metabolic disease years before glucose abnormalities appear. Time-restricted eating, reducing meal frequency, lowering overall carbohydrate load, and regular exercise, particularly strength training, all improve insulin sensitivity.
Lipid Markers: Beyond Simple Cholesterol
Lipid panels are among the most common blood tests, yet most people receive only basic interpretation. Total cholesterol and LDL cholesterol get the most attention, but they’re surprisingly poor predictors of cardiovascular events in many individuals. More sophisticated lipid analysis reveals risk factors that standard panels miss entirely.
Triglycerides are fats in the blood that serve as both independent cardiovascular risk factor and indicator of metabolic health. Optimal triglycerides are under 100 mg/dL, with levels over 150 mg/dL considered elevated. High triglycerides often accompany insulin resistance, excessive refined carbohydrate and alcohol consumption, and physical inactivity. The research is clear that triglycerides respond dramatically to lifestyle intervention: cutting refined carbs and alcohol, increasing omega-3 fatty acids from fatty fish or supplements, and engaging in regular aerobic exercise can reduce triglycerides by 20-50% in weeks.
HDL cholesterol, often called “good” cholesterol, participates in reverse cholesterol transport, removing excess cholesterol from tissues and returning it to the liver for excretion. Higher HDL levels associate with better cardiovascular protection. Optimal HDL is over 60 mg/dL for men and over 70 mg/dL for women, while levels under 40 mg/dL (men) or 50 mg/dL (women) increase cardiovascular risk. Exercise is the most effective intervention for raising HDL, particularly vigorous exercise. Modest alcohol consumption shows benefits in some studies, though this remains controversial given alcohol’s other health effects. Reducing refined carbohydrates, which tend to lower HDL and raise triglycerides, also helps.
The triglyceride to HDL ratio synthesizes these lipid markers into a single powerful predictor. Optimal is under 2:1, meaning if your triglycerides are 100, your HDL should be 50 or higher. Ratios over 3:1 are concerning and indicate metabolic dysfunction. This ratio predicts cardiovascular and metabolic health better than individual lipid markers alone, with some researchers suggesting it’s among the most valuable cardiovascular risk indicators available from a standard lipid panel. Dr. Robert Lustig at UCSF has argued that this ratio, rather than LDL alone, better captures metabolic risk because it reflects insulin resistance, which drives much of cardiovascular disease.
Apolipoprotein B (ApoB) represents the most advanced lipid marker for cardiovascular risk assessment, though it’s not always included in standard panels. Every atherogenic lipoprotein particle (the particles that contribute to plaque formation) contains exactly one ApoB molecule. This means ApoB directly counts the number of dangerous particles, while LDL cholesterol measures the cholesterol content of those particles, which varies between individuals. Optimal ApoB is under 80 mg/dL, with levels over 100 mg/dL elevated. Research from Dr. Allan Sniderman at McGill University has demonstrated that ApoB outperforms LDL cholesterol as a cardiovascular risk predictor, leading some clinicians to prioritize this marker over traditional LDL testing.
Physical Performance Biomarkers: The Strongest Predictors
Physical function markers, how well your body actually performs, predict health outcomes more powerfully than many blood tests. These assessments capture the real-world effects of your metabolic health, muscle mass, cardiovascular fitness, and neurological function. They’re simple to measure, free to assess, and remarkably predictive of mortality and disability.
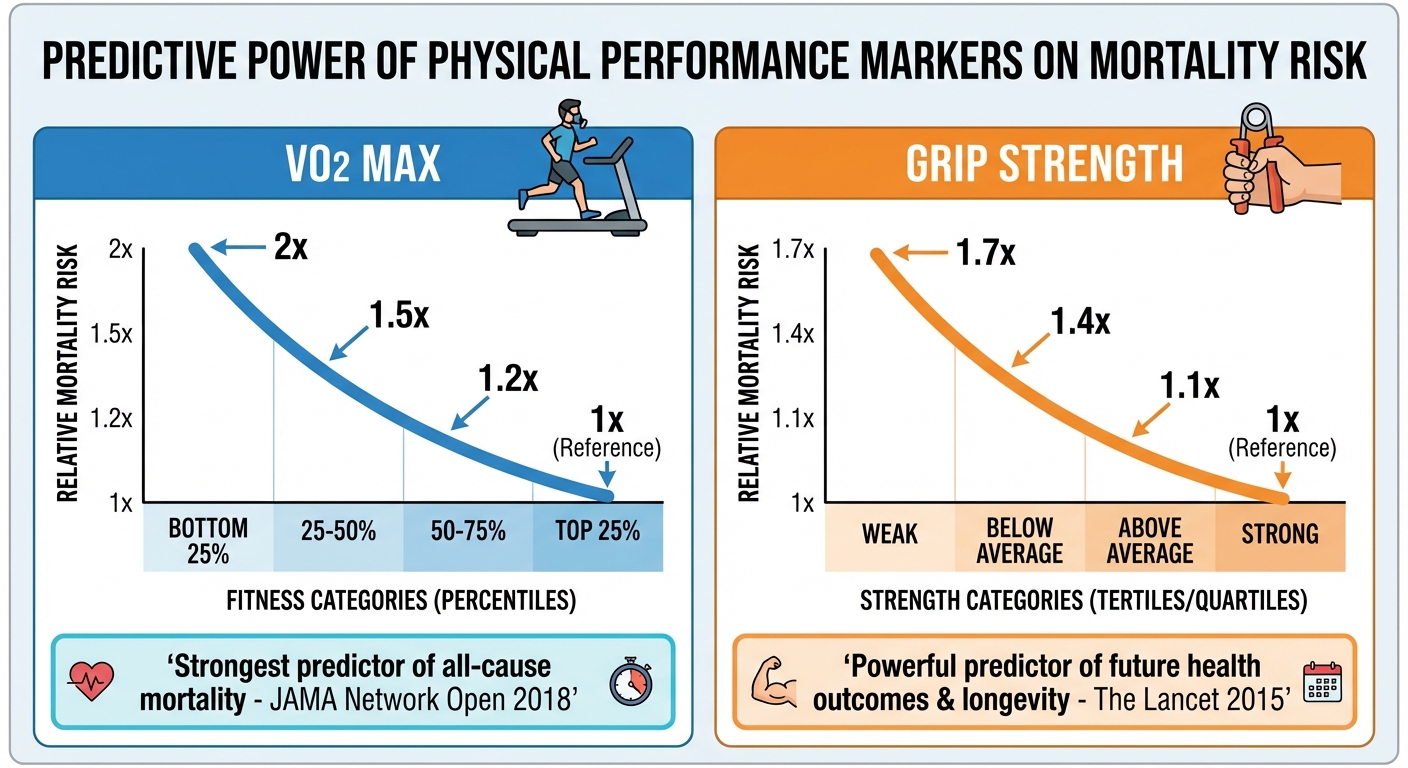
VO2 max measures your maximum oxygen consumption during intense exercise, representing your cardiovascular system’s capacity to deliver oxygen to working muscles. This single metric is the strongest predictor of all-cause mortality, better than any blood marker, better than BMI, better than blood pressure. Research published in JAMA Network Open in 2018 found that cardiorespiratory fitness, measured by VO2 max, was the single most important predictor of longevity, more so than smoking, diabetes, or hypertension. People in the top 25% for their age group have roughly half the mortality risk of those in the bottom 25%.
Optimal VO2 max values vary by age and sex, but the general principle is clear: higher is better, and the benefits don’t plateau. Moving from the lowest fitness category to the average category provides the largest mortality reduction, but continuing to improve provides additional benefit. Dr. Attia argues that maintaining a VO2 max in the top quartile for your age should be a primary longevity goal, as it provides broader protection than almost any other intervention. Improve VO2 max through aerobic exercise, particularly high-intensity interval training that pushes your cardiovascular system to adapt.
Grip strength serves as a proxy for total body strength and muscle mass, and its predictive power consistently surprises researchers. A 2015 study in The Lancet following nearly 140,000 adults across 17 countries found that grip strength predicted cardiovascular mortality better than systolic blood pressure. Low grip strength, under 26 kg for men or under 16 kg for women, associates with increased mortality, disability, hospitalization, and loss of independence. This simple measurement with an inexpensive dynamometer predicts functional decline years in advance. Improve grip strength through resistance training, particularly pulling movements like rows, pull-ups, and deadlifts that directly challenge grip alongside larger muscle groups.
Walking speed predicts mortality, hospitalization rates, and functional decline in older adults with remarkable accuracy. Researchers sometimes call it the “sixth vital sign” because of its predictive utility. Gait speed over 1.0 meters per second (about 3.3 feet per second, or roughly walking a mile in under 27 minutes) is optimal, while speeds under 0.8 m/s indicate significantly increased risk. This marker captures the integrated function of muscles, joints, balance, cardiovascular fitness, and neurological coordination. A person’s walking speed reflects multiple body systems simultaneously, which explains its predictive power. Improve walking speed through regular walking practice, leg strengthening exercises, balance training, and overall fitness development.
Muscle mass measured through DEXA scan (most accurate) or bioelectrical impedance (less precise but more accessible) should be maintained or ideally increased, especially after age 40 when sarcopenia, age-related muscle loss, accelerates. Beginning around age 30, adults lose 3-8% of muscle mass per decade, with the rate accelerating after 60. Loss of muscle mass predicts disability, increased fall risk, loss of independence, and mortality. The resistance training approaches used in BFR offer one option for those who can’t lift heavy weights, but any form of progressive resistance training preserves muscle. Adequate protein intake, 1.2-1.6g per kg body weight, supports muscle maintenance and synthesis.
Inflammatory Markers: The Background Damage
Chronic inflammation is perhaps the most fundamental driver of aging and age-related disease. Unlike acute inflammation, the beneficial response to injury or infection that resolves when the threat passes, chronic low-grade inflammation damages tissues over years, accelerating cardiovascular disease, cancer, diabetes, dementia, and overall decline. This “inflammaging,” as researchers call it, operates silently in the background, measurable only through specific blood tests.
C-Reactive Protein (CRP) measures systemic inflammation through a protein produced by the liver in response to inflammatory signals. The high-sensitivity version (hs-CRP) detects the low levels of inflammation relevant to chronic disease risk. Optimal hs-CRP is under 1.0 mg/L, moderate inflammation ranges from 1.0-3.0 mg/L, and high inflammation is over 3.0 mg/L. CRP predicts cardiovascular events, diabetes onset, and dementia risk independent of traditional risk factors. The JUPITER trial, a landmark study published in New England Journal of Medicine, demonstrated that even people with normal cholesterol but elevated CRP benefit from statin therapy, establishing inflammation as an independent cardiovascular risk factor.
Reducing CRP requires addressing the sources of inflammation: anti-inflammatory dietary patterns like the Mediterranean diet rich in omega-3 fatty acids and colorful vegetables, regular exercise which has profound anti-inflammatory effects, weight loss if overweight since adipose tissue produces inflammatory cytokines, quality sleep since sleep deprivation is profoundly inflammatory, and effective stress management. Many of the hormetic stressors that improve resilience, including exercise, cold exposure, and certain phytochemicals, work partly by reducing chronic inflammation through hormetic adaptation.
Homocysteine is an amino acid that, when elevated, damages blood vessels and increases risk of heart disease, stroke, and dementia. It’s produced during methionine metabolism and should be rapidly converted to harmless compounds through pathways requiring B vitamins. Optimal levels are under 7 µmol/L, with anything over 10 µmol/L considered elevated. The good news is homocysteine responds dramatically to B vitamin supplementation. Folate (B9), B12, and B6 work together to facilitate homocysteine conversion. This is one of the few biomarkers where supplementation provides clear, measurable benefit, particularly for those with MTHFR genetic variants that impair folate metabolism.
Body Composition: Where Fat Lives Matters
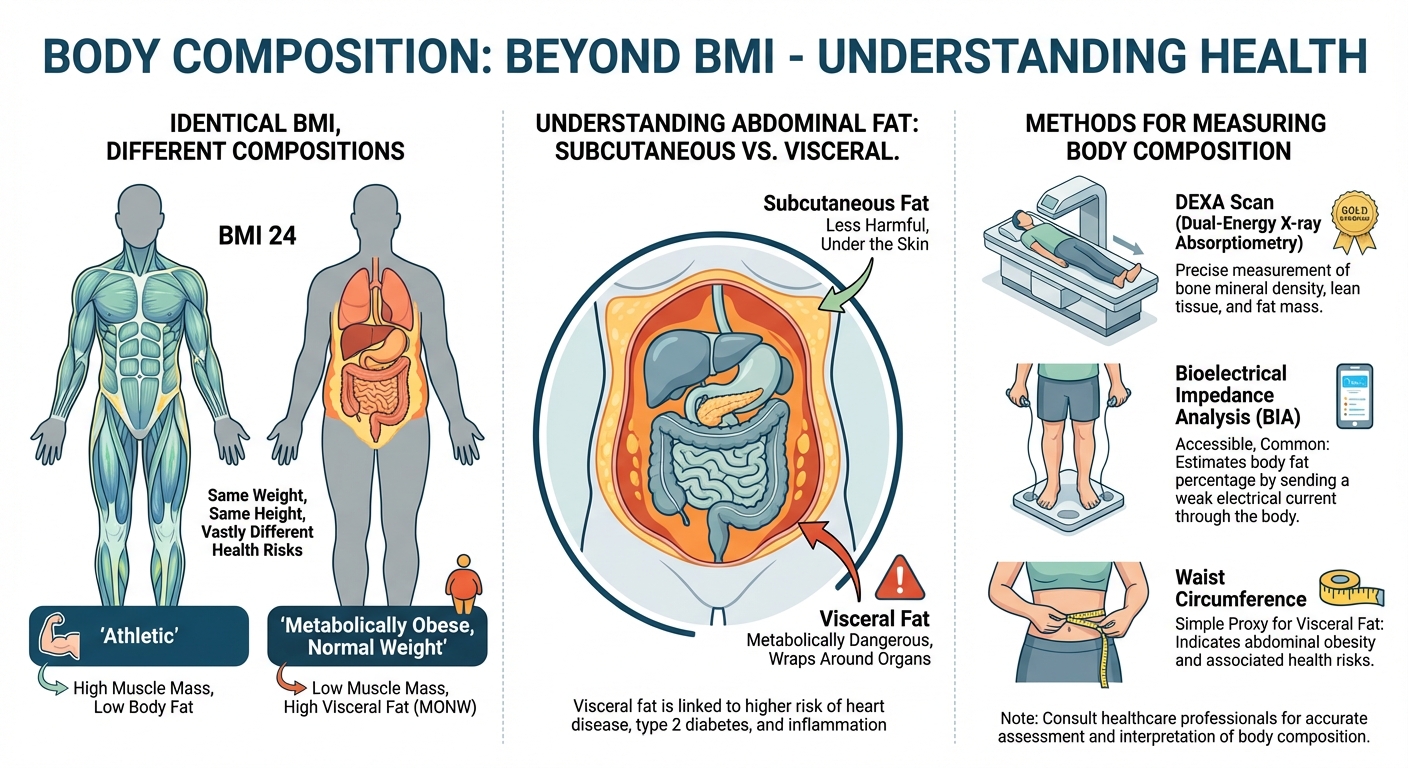
Where you carry body fat matters as much as how much you have. Body composition markers reveal metabolic health in ways that simple weight or BMI cannot. Two people with identical BMI can have vastly different metabolic risk profiles based on fat distribution and muscle mass.
Waist circumference measures abdominal fat, including the visceral fat that accumulates around organs and is most metabolically harmful. Optimal measurements are under 37 inches (94 cm) for men and under 31.5 inches (80 cm) for women. Visceral fat is hormonally active tissue that produces inflammatory compounds and interferes with insulin signaling. Even people with normal BMI can have excess visceral fat, a condition sometimes called “TOFI” (thin outside, fat inside), which creates metabolic risk invisible to standard weight assessment. Reduce waist circumference through overall weight loss, strength training which preferentially reduces visceral fat, and reducing refined carbohydrate intake which particularly drives abdominal fat accumulation.
Body fat percentage provides more precision than BMI, which can’t distinguish muscle from fat. Healthy ranges are 10-20% for men and 18-28% for women, with lower percentages generally associated with better health outcomes up to a point. Excessively low body fat creates hormonal and health problems, particularly for women. DEXA scan provides the gold standard measurement, simultaneously assessing bone density and regional fat distribution. More accessible options include bioelectrical impedance scales (less accurate but useful for tracking trends) and skinfold calipers (technique-dependent but reasonable accuracy). Whatever method you choose, tracking trends over time matters more than absolute precision.
Creating Your Testing Protocol
A single data point is just a snapshot; it tells you where you are today, but not where you’re heading. The real power of biomarker testing lies in trend analysis. By testing regularly, you can see the trajectory of your health and intervene before minor deviations become major pathologies. However, testing too frequently creates noise and anxiety, as biomarkers naturally fluctuate day-to-day. Testing too rarely means you might miss the window for early intervention.
Annual testing should include a complete metabolic panel covering glucose, electrolytes, and kidney function. Add a lipid panel, high-sensitivity CRP, vitamin D, and a complete blood count. These tests provide the foundational data for assessing metabolic and inflammatory status. Most of these are covered by routine insurance for annual physicals, making them accessible and affordable.
Every 2-3 years, expand testing to include HbA1c if glucose is normal, advanced lipid testing including ApoB and particle size if cardiovascular risk is a concern, iron and ferritin levels, and thyroid function. These tests provide deeper insight into specific systems and catch slower-developing problems. For those with identified risk factors or previous abnormal results, more frequent testing of specific markers makes sense.
Physical performance assessments follow a different schedule. Formal VO2 max testing is most useful annually for those actively training, though simpler proxy tests like a 12-minute Cooper test can be done more frequently. Grip strength is simple enough to check monthly at home with an inexpensive dynamometer. Walking speed can be assessed any time with a measured path and stopwatch. DEXA scans for body composition every 1-2 years provide valuable trend data on muscle mass and fat distribution.
The Bottom Line
Longevity biomarkers provide a dashboard for monitoring healthspan, not just lifespan. The markers that predict longest, healthiest lives aren’t always the ones receiving most clinical attention. VO2 max and grip strength outperform many blood tests for mortality prediction. Metabolic markers like fasting insulin and triglyceride-to-HDL ratio catch dysfunction years before standard tests show problems. Inflammatory markers reveal background damage that accelerates aging.
You don’t need perfect scores on everything. The goal is trajectory improvement: moving from high-risk to moderate-risk, or from moderate to optimal. Track trends over time, intervene when markers worsen, and celebrate when lifestyle changes produce measurable improvement. A CRP dropping from 3.2 to 1.4, a VO2 max rising from 35 to 41, grip strength increasing from 30 to 35 kg, these improvements aren’t just numbers. They represent years of healthy life preserved.
If you could focus on only one area, prioritize physical capability: cardiorespiratory fitness and strength. Strong, fit people have better metabolic health, less inflammation, and better nutrient status than weak, unfit people. The exercise and physical performance approaches that build functional fitness provide foundation for all other health improvements. Start with movement. Other improvements follow.
Your Biomarker Priority Protocol:
- Annual basic testing: metabolic panel, lipids, hs-CRP, vitamin D, CBC
- Track VO2 max annually (formal test or Cooper test proxy)
- Monitor grip strength monthly with home dynamometer
- DEXA scan every 1-2 years for body composition trends
- Add HbA1c and advanced lipids every 2-3 years if basics are normal
- Prioritize interventions based on biggest deviations from optimal
- Retest after 3-6 months of lifestyle intervention to assess response
Sources: JAMA Network Open cardiorespiratory fitness and mortality meta-analysis (2018), Lancet grip strength and cardiovascular mortality study (2015), Diabetes Care glucose and mortality research, New England Journal of Medicine JUPITER trial, McGill University ApoB research (Dr. Allan Sniderman), BYU insulin resistance research (Dr. Benjamin Bikman), UCSF metabolic health research (Dr. Robert Lustig).